eLearning Log in
Login here using your username and password
How do I review project risk?
Introduction
Delays to the project will normally be the result of a risk occurring, and it is therefore prudent to build in contingency or allowance for things going wrong. The calculation of contingency will involve a review of the risk and issue logs, and calculation of the impact of the risk against specific work packages, tasks and activities.
Factors that may increase risk include:
- Dependency on a limited group of resources
- Lack of availability of specific knowledge or skills to deal with the tasks
- Delays in decisions being made
- Lack of availability of funds to pay for the resources
- Confusing the time required to do the task with the period window when it will be done
- Technology or asset performance that was assumed, but was not checked during estimation.
If the resources are in high demand by other projects and there are no alternative suppliers then the risk will increase significantly, in particular the period window when they may be available. It may be 3 hours’ work, for example, but if no one is available for 6 months the task will take 6 months.
This extract has been reproduced with permission from A Practical Guide to Project Planning, TSO 2016. If you’d like to read more you can purchase the copy of the book here.
Technique
This is the point where you apply your risk and issue management knowledge. The main technique here is but scenario planning is also an important technique to use to check that you have not missed any potential risks. Once you have put your overarching plan together, it is worth standing back and looking at scenarios that could happen, both positive and negative.
Projects rarely fail as a result of one risk or issue. Failure normally results from either:
- A cocktail of threats igniting to cause a major problem, such as when a number of events happen simultaneously, and unforeseen connections cause the totality of the impact to be more severe than the component parts, or
- A sequence of events developing that trigger a risk, followed by knock-on effects that trigger further negative effects, thus causing a much bigger problem than the component parts.
Scenario planning can only really be achieved through a workshop of key people who understand the potential threats and opportunities. It is likely that many of the scenarios that need to be tested have already been identified in the risk and issue logs, but this step is more focused on their cause and the effect on your estimates.
It is important to assess probability, impact and proximity of all risks. Separating the significant few from the trivial many helps us do an aggregation test of ‘So what?’, which will help to determine the extent to which the risk can be accepted or must be mitigated.
Some scenarios that should be considered with their knock-on effects are listed below:
- Resources available to the project – more or less?
- Costs resulting from procurement – higher or lower?
- Budget – cut or increased?
- Organizational context changes for the project – for example, are there changes of priorities? And are there changes to the organization or project leadership?
- Stakeholder commitment – positive or negative?
The results of considering scenarios will require a review of contingency, and development of alternative approaches and plans. This will involve the development of contingency plans, that will be introduced as ‘exception plans’.
Example
The diagram below can be used to map the likelihood and impact of risks. You can also start to draw the potential relationships between risks. For example, in the diagram below, Risk A could trigger Risk E and so could Risk B. If Risks E and B are becoming more likely the overall level of risk will be rising. In reality, such a diagram often ends up on an A3 sheet but it is much more effective than long lists of risks.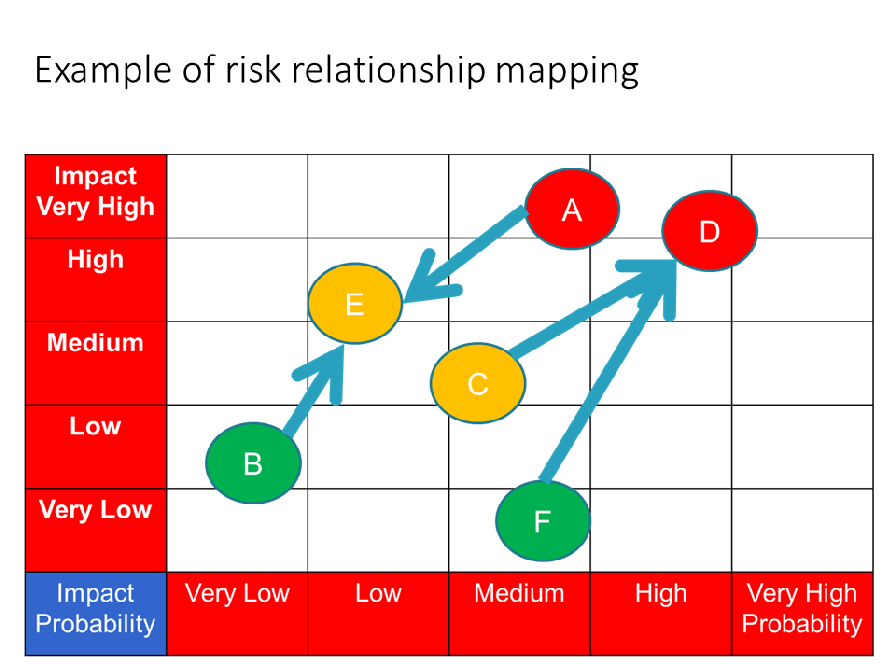
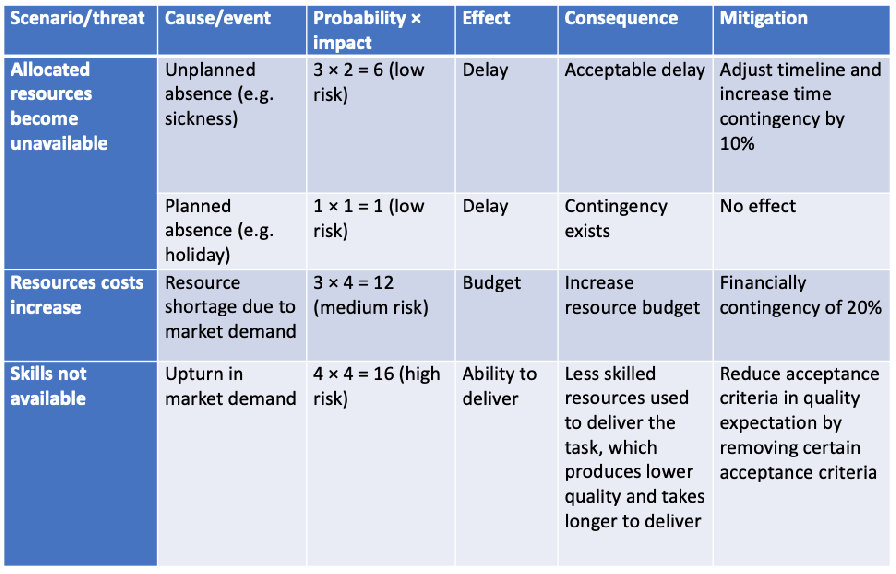
The table below lists some scenarios that could cause a shortfall of resources. We have used numbers to illustrate the probability and impact, with 1 being very low and 5 very high. (In this example we ignore proximity but note that it adds a sense of urgency for mitigation.) The multiplication of the probability with the impact gives a number which can then be related to the risk strategy. For example, we may say that scores of 1–6 are low risk, 7–12 are medium risk and 12–25 are high risk.
Risk assessment for different scenarios