eLearning Log in
Login here using your username and password
How do I develop the project schedule?
Introduction
To develop the schedule, it is necessary to know the sequence of events that was defined during the Designing the Plan stage and put a timescale against each one.
There are a number of dependencies that will need to be considered when constructing the schedule:
- The relationship between outputs (this is also known as dependencies)
- What resources are being used (they can’t do two tasks at once)
- Availability of resources, particularly specialists (e.g. legal)
- What assets or services will need to be used to support the tasks (e.g. hardware for prototyping or test lab facilities)
- Governance obstacles, EU procurement regulations or human resources agreement
- Non-negotiable deadlines (e.g. legal compliance).
Resource planning, critical path analysis (CPA) and Gantt charts are some of the main techniques used while developing the schedule.
This extract has been reproduced with permission from A Practical Guide to Project Planning, TSO 2016. If you’d like to read more you can purchase the copy of the book here.
Technique: Resource Planning
For the estimation of the resources for the project, products will need to be broken down into tasks and activities, which make up the work packages. The table below shows how this can be done.
Tasks, activities and resources associated with a work package
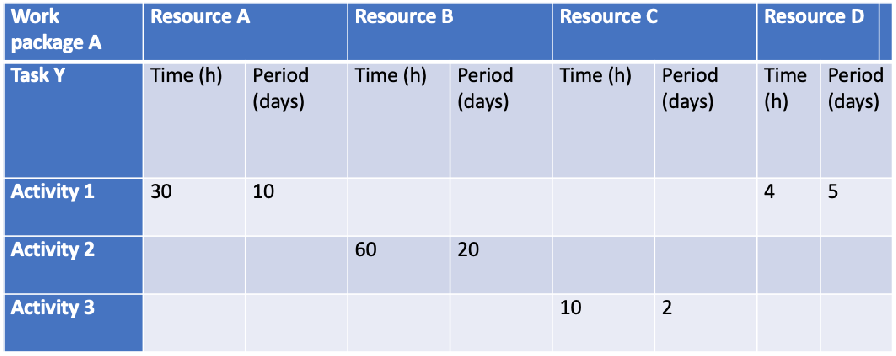
In Table 4.7, we have a work package A that is made up of a number of tasks. For Task Y, there are three activities. There are four resources involved. Using three-point estimating, we have calculated the number of hours (time) that the task will take and the number of days (period) during which the activity will be undertaken. It is important to recognize these two different variables. The ‘period’ is the window of time during which the work will be done; there may be many reasons why it extends beyond the actual hours.
Tip
Wherever possible get the person/organization who will do the work to provide the estimates for the times and periods needed for an activity and then gain their explicit commitment to the resourcing profile.
Example: Resource Planning
The example here (see the table below) is for an office move over the weekend. The estimate has to take account of the following:
- There are 10 people from Operations moving office (hence 10 people each spending 5 hours packing desks in one day)
- There are three facilities management (FM) staff involved in the office move on the Saturday
- One IT person will need to work for a total of 7 hours on the Sunday cabling up the workstations and installing phones
- Health and Safety will need to spend 4 hours checking the workstations and office on the Monday.
An example of a work package for an office move broken down into activities and resources
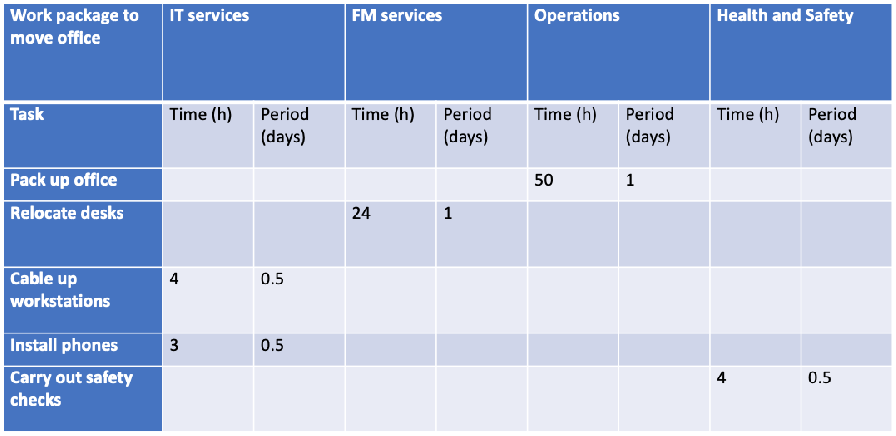
By adding up the figures entered in the table above you can see that the total time needed for the move is 85 hours, completed during a period of 3.5 days. What is missing at this stage is the connection and dependency between the tasks and activities, which is picked up later in scheduling.
In calculating the time it is important to focus on the actual hours to get an accurate estimate. The concept of ‘person-days’ means different things to different people and is open to considerable interpretation so should be avoided.
Once you have worked out the time/resources needed, you can calculate the cost. It is important to keep an audit trail of how you reach your estimates, because should the project be audited or some aspect of the delivery handed over to someone else, they will need to know the basis of your estimation and how you achieved your plan.
The budget for the project can now be established, based on the costs of resources and any external expenditure that is required to purchase assets etc.
Technique: Critical Path Analysis
Using the helpline example we can draw up a product sequence diagram (see Figure 4.6) to illustrate the relationships. It is then possible to use a technique called critical path analysis (CPA) to work out how long the project will take and what can or cannot be changed without having an impact on the schedule.
Figure 4.6 A product sequence diagram for the helpline example
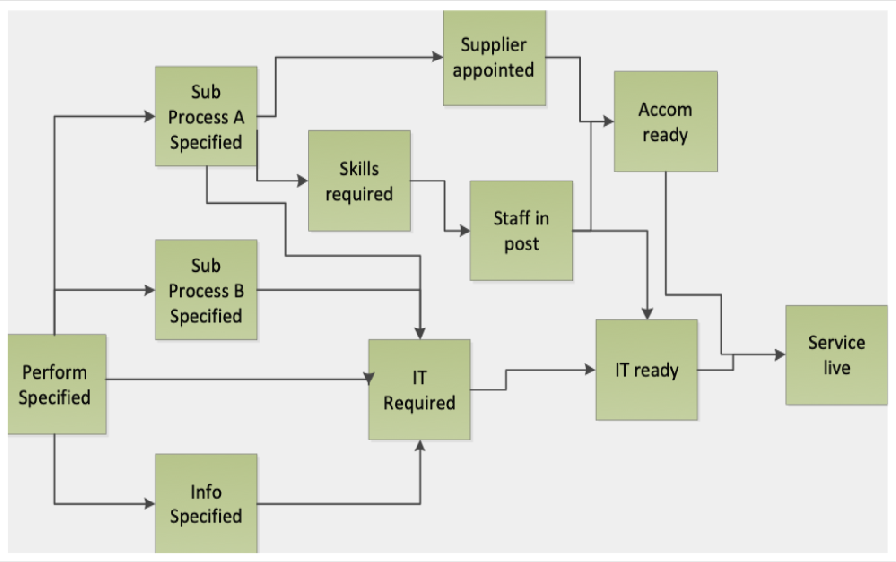
The key information which is required for each task is:
- How long will it take?
- What is the task is dependent on?
Example: Critical Path Analysis
Table takes the tasks from Figure 4.6 and adds in information on how long each will take and how it depends on each other tasks. For simplicity, the periods of time are given in whole days. Using this table it is possible to calculate the earliest point at which the task starts and when it will finish.
Table Example Critical Path Analysis data
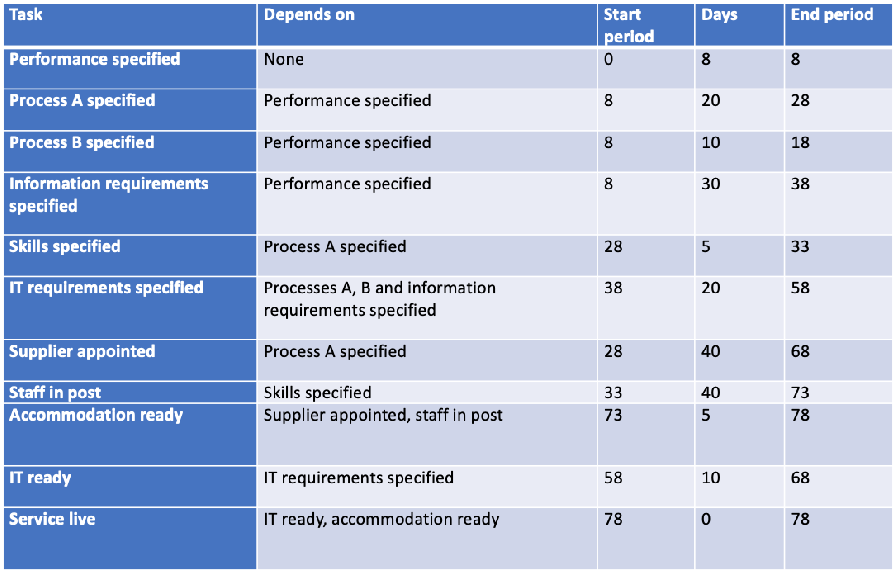
From Table 4.9 you can see that the minimum number of days that it will take to deliver the project will be 78 days. It is also possible to deduce which tasks have no flexibility and those that have.
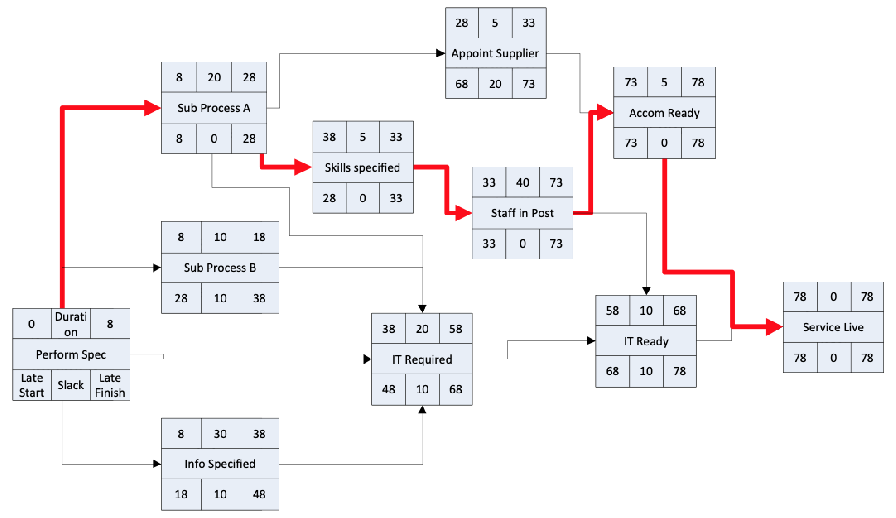
In CPA we simply map the information from Table 4.9 into our product sequence diagram to work out the longest route through the project and identify the tasks that have slack associated with them. Figure 4.7 shows the information contained in each of the task boxes, while Figure 4.8 shows these boxes completed for the helpline example with the critical path shown using a bolder line.
Figure 4.7 Information to fill in for each task box in critical path analysis
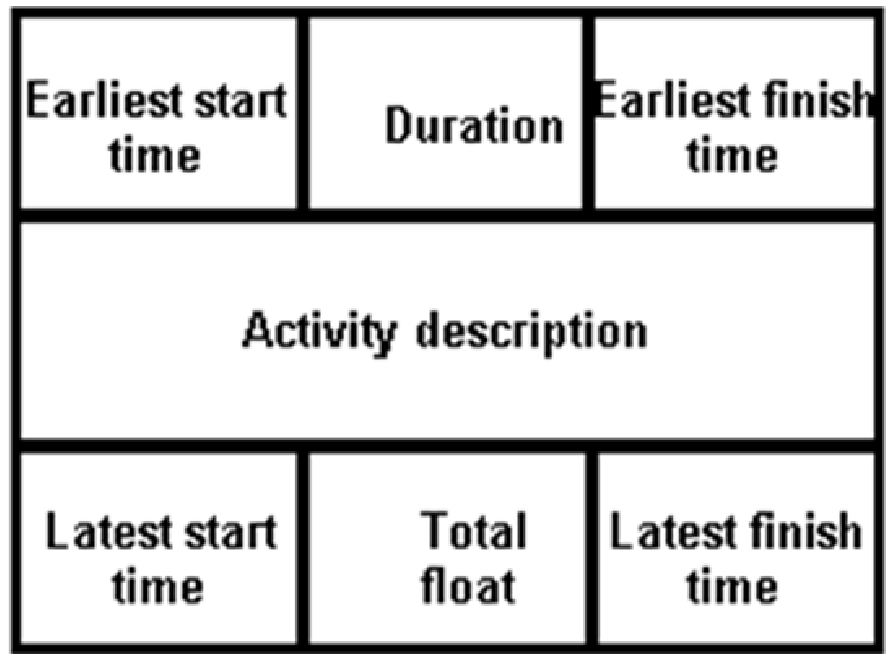
Figure 4.8 Data mapped into the product sequence diagram and the resultant critical path
The top row of each of the task boxes identifies the earliest start date (dependent on other tasks) and the task’s duration (how long it takes), which then gives you the earliest finish time for the task.
The figures in the bottom row of the task box can be calculated by working backwards from the total length of the project. The latest finish time for each task is the latest start time from the tasks that are dependent on it. The float is the difference between the earliest finish time and the latest finish time. The latest start time is the latest finish time minus the duration.
The tasks with zero float represent the critical path for the project and should be managed intensively. The tasks that have some float have slack that can be used to make sure that time isn’t lost on the critical path.
Behind each one of these tasks there will be a three-point estimate that has led you to the calculation of the effort required. If any of the resources are deployed on parallel tasks you need to be aware of it, as this means the tasks must become consecutive or will need float to enable them to happen in the timescale.
The critical path tasks could be used for the project milestones.
Technique: Gantt chart
The information required for the scheduling is usually stored in varying levels of detail in tables and diagrams but these may not be easy for people to follow. It is therefore good practice to also have a simple graphical illustration (a Gantt chart) of the project to show the tasks against a time line. A Gantt chart can easily be created using spreadsheet, diagramming or project management software.
Example: Gantt chart
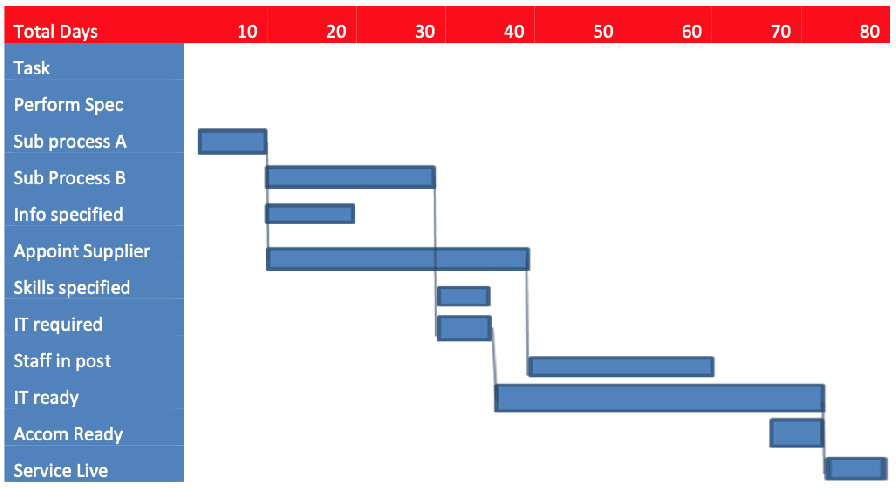
Figure 4.9 is the same project that was used in Figure 4.8 but illustrated against a timeline of days and created in a spreadsheet.
Figure 4.9 Gantt chart example
Finalizing the resource plan
Once the schedule is in place it is possible to finalize the resource plan. Each area that provides resources, internal or external, should be consulted and asked to commit to providing the specified resources when they are needed. A common fault in project planning is to assume that internal groups, in particular, can produce resources when they are needed and without warning.